7 min read
A wellness app concept that brings every ZANA wearable and all its health data into one place.
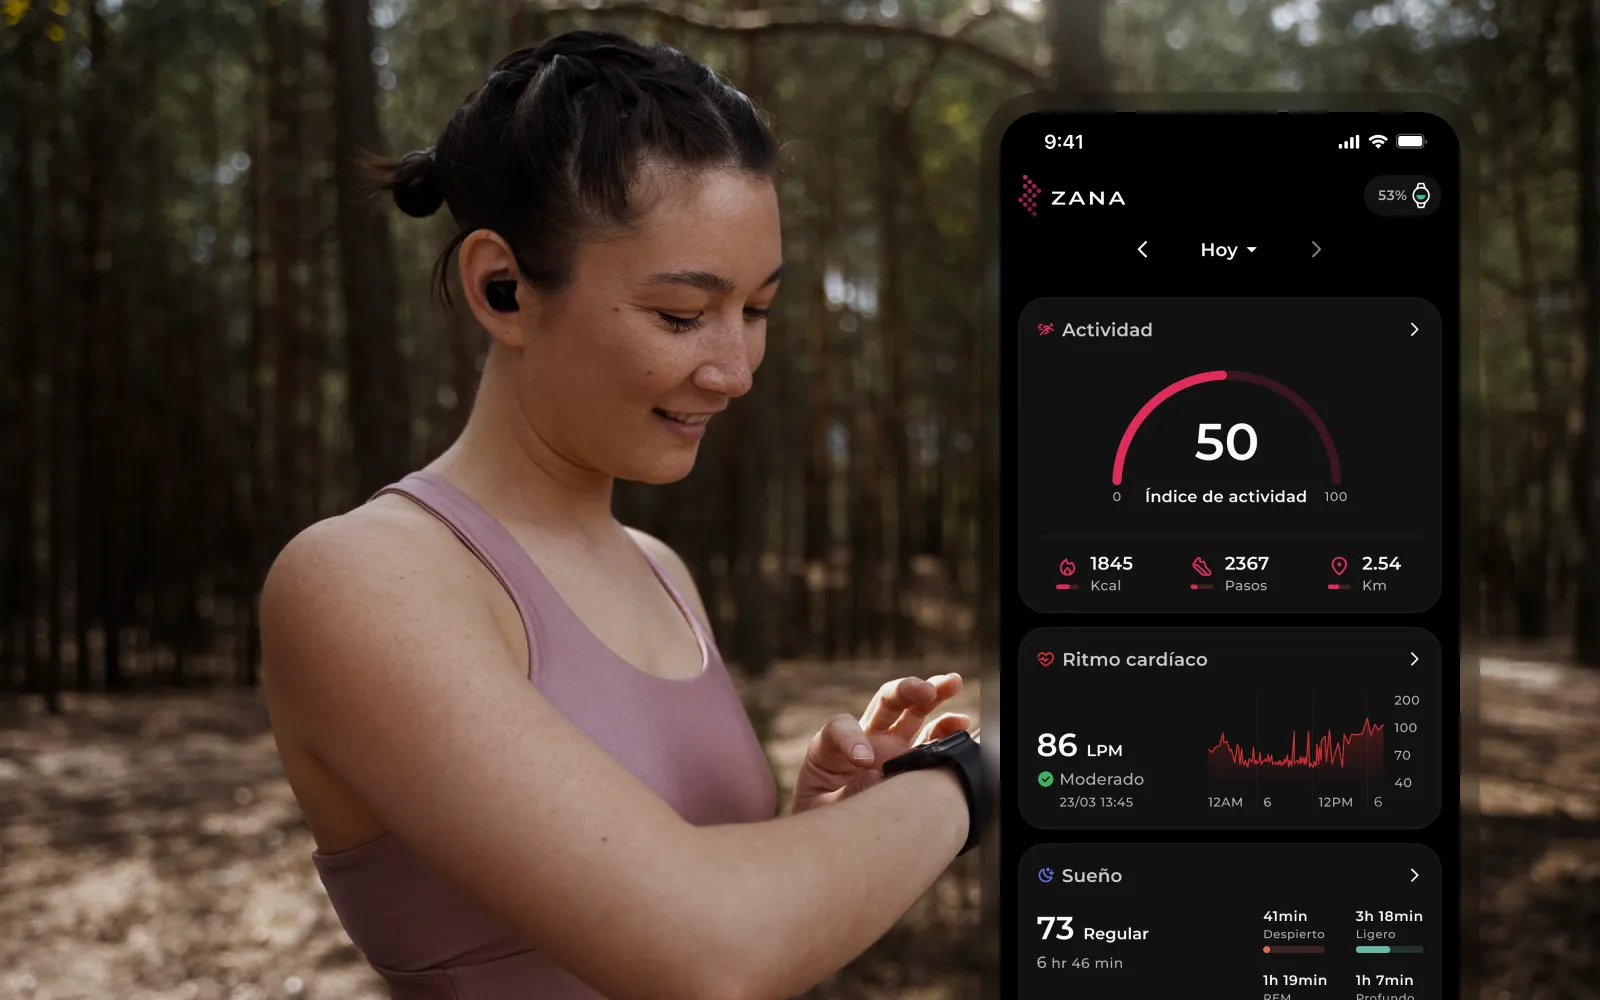
Overview
ZANA is preparing to sell its own line of wearables, from smartwatches and bands to smart rings, glasses and glucose meters. I designed the app that brings them all together, so people can manage every device and see all their health data in one place. I built it at MiDoctor24h as an interactive prototype for an investor pitch, working directly with the company's owner.
The context
ZANA's devices are grouped into product lines: ZANA Active and Elegance smartwatches, Core bands, Orbit rings, Motion & Vision glasses and Balance glucose meters. Giving each device its own app made no sense, especially since many people would own more than one. The owner asked me for a single app to manage every device and the metrics they record. It had to look modern, feel intuitive and make it easy to understand what's being measured every day.
The app is meant for health-conscious people between 25 and 45, from business owners to athletes. Instead of checking what the watch measured in one app and what the band measured in another, they see everything together. Behind the scenes, the app would combine the data from each device. A ring, for example, can be worn day and night, while many people take their watch off to sleep.
The challenge
An app that reads several devices can easily turn into a wall of numbers. The challenge was to show every metric in a friendly way that didn't overwhelm people, keeping the information as simple as possible without leaving anything important out.
Process
I studied apps like Whoop, Google Fit, Samsung Health and Oura to see where they agreed and what set each one apart. I also talked with people who use smart devices every day about the apps that came with them, what bothered them and what they'd change.
I sketched the wireframes by hand and then built a component library for the whole app, from the charts for each metric to the sleep index cards. As in all my projects, every screen has its empty and error states. Since the goal was an investor pitch, I turned the design into an interactive Figma prototype, and before handing it over I asked a few people to try it and tell me what they thought.
No password to forget
People forget their passwords all the time, so Zana doesn't use them. To sign in, you enter your email and type the code you receive, or continue with your Apple or Google account. Then the app asks for a few basic details: name, date of birth, sex, height and weight.
The whole day at a glance
The home screen opens with an activity index in a ring, a single number that sums up how much effort you put in during the day and nudges you to beat it tomorrow. It would combine calories, steps, distance, heart rate and sleep, and adapt to the data your devices send. If your watch doesn't track sleep, sleep simply doesn't count toward the index. Below it come cards for heart rate, sleep and the rest of your metrics, each one leading to its own detail.
The whole app revolves around connecting devices, so someone who hasn't added one yet sees a card inviting them to do it right on the home screen. The metrics stay visible but at zero, a preview of everything the app can track once a device is connected.
All your devices in one list
The Devices tab shows each device, whether it's connected, its battery level and when it was last charged. To add one, you first choose the category and then the model, since each category holds several models. If you don't have a ZANA device yet, a link takes you to the store.
Every metric, from one day to a whole year
This is the part I'm proudest of. Heart rate, sleep, blood pressure and blood oxygen each have their own screen, with tabs for day, week, month and year. The chart changes with the period, a continuous line for a single day and ranges for longer periods, and tapping any point shows its exact value. Below the chart, a summary shows the average, highest and lowest values, and "See all data" opens the full list of measurements. The question mark at the top explains what's being measured and what's considered normal. The goal was for people to see the whole picture, from a single reading to a year-long trend.
Sleep, explained
Sleep gets extra detail: time asleep versus time in bed, a chart with the light, REM, deep and awake stages, and a sleep index with a rating from Excellent to Poor. Each rating comes with a short tip, so the number is never left on its own and you always know what to do next. When there's no data, the screen explains that you need to wear your device to bed.
Where it stands
Zana was designed as an interactive Figma prototype to present to investors, and it hasn't gone into development.
What I'd improve
I didn't design the pairing process itself. Each device connects to the app in its own way, which makes it one of the most complex and interesting parts of the experience. Many other screens were left out too, because the prototype only needed what the pitch required. Those would be my next steps.